Cherry Tree and Global Warming: to bloom or not to bloom?
Simone Conradi
2 Jul 2018
•
2 min read
The answer appears to be "to bloom", and please let me add "earlier and earlier". In Kyoto, a great Japanense city also famous for its magnificent cherry tree blooming during spring, it is almost a true fact that the spring is starting earlier and earlier every year. Thanks to the meticulous work of Aono, Kazui and Saito, the historical Series of Phenological data for Cherry Tree Flowering at Kyoto City is available to everyone at the link above. As far as I know, this phenological dataset is unmatched in the world because of its large spanned period, more than 1000 years!
"I have searched and collected the phenological data for full flowering date of cherry tree (Prunus jamasakura) from many diaries and chronicles written by Emperors, aristocrats, governors and monks at Kyoto in historical time. The dates, on which cherry blossom viewing parties had been held or full flowerings had been observed, were collected from old documents. On this page, you can see the long series of phenological data of full flowering for the cherry tree at Kyoto since the 9th century." Yasuyuki AONO.
Data science passion mixed with love for Nature and with few Python lines of code produced the plot below. The x-axis represents years AD, starting from 812 AD. Y-axis counts the number of days passed since the January 1st of each year. For every year with phenological data, the blooming date is represented by a blue dot. As you could see, the volatility is quite large but taking a rolling mean clarifies the trend of the blooming dates: this is the red curve. The light blue area represents the range +/- 1.96 standard deviations around the mean value. The lower is the red curve, the earlier the cherry trees are blooming and vice-versa.
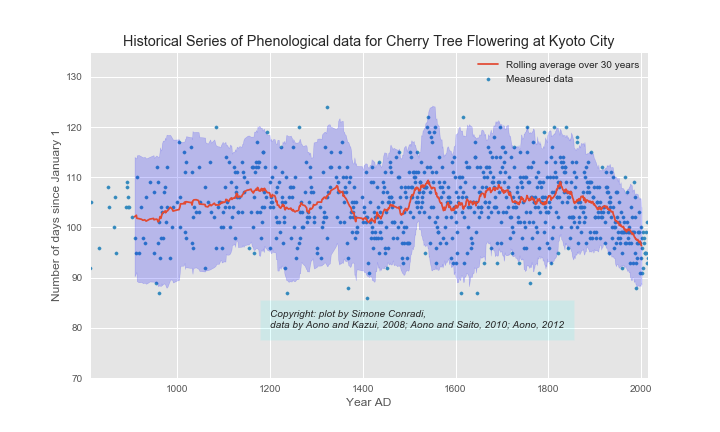
The rolling mean shows a clear decreasing trend starting from 1825 AD give or take: on average Prunus Jamasakura are blooming earlier and earlier every year. Is this because of global warming or only because of local weather or climate effects?
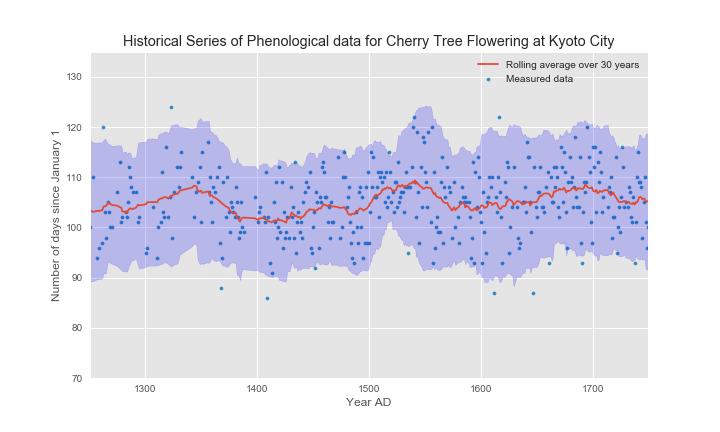
Zooming between 1250 AD and 1750 AD shows three periods with relatively late blooming on average: they are centred around 1350 AD, 1540 AD and 1680 AD more or less. Are they closely related to the Little Ice Ages experience in Europe that began in 1315 AD, 1550 Ad and 1650AD respectively? Maybe yes…
References
- Aono and Kazui, 2008; Aono and Saito, 2010
- Aono and Kazui, 2008; Aono and Saito, 2010
- 2012 Aono (2012; Chikyu Kankyo (Global Environment), 17, 21–29)
- http://atmenv.envi.osakafu-u.ac.jp/aono/kyophenotemp4/

WorksHub
Jobs
Locations
Articles
Ground Floor, Verse Building, 18 Brunswick Place, London, N1 6DZ
108 E 16th Street, New York, NY 10003
Subscribe to our newsletter
Join over 111,000 others and get access to exclusive content, job opportunities and more!