Optimizing the Performance of a React Progressive Web App
Leandro TK
19 Dec 2022
•
17 min read

In the last quarter, I started working in a new team with different business goals. It was a great team, really fun to work with, and we did a lot of amazing work that I'm proud of.
One of the projects we managed in the last 4 months was web performance improvements for the application we were working on. This post intends to share the improvements we made and the things we learned throughout this process.
Context
Before we start a conversation about web performance, it's important to show the context behind this work.
The first thing I want to mention is the fact that the application (PWA) we started to work on had (actually it still has) most parts of the codebase written 2 years ago. It's a React PWA using Webpack 3, Babel 6, react-redux 5, and so on. A small number of hooks. Most classes components.
The project didn't have real ownership of a team or responsible engineer to take care of the codebase. Different teams need to add features here and there in the PWA but don't actually own the codebase. Effect: the codebase grows in features, bugs, and tech debt, but it is not improved nor refactored.
With this context, we already had a lot of space to improve the codebase. This project was our focus and started to be our own responsibility as well.
My colleague and I became "Service Owners" for this project. The idea of the "Service Owners" is someone (or two people in this case) to be the focal point to clear doubts, manage the tech debts, issues, bugs, etc. Basically, someone that takes care of a project.
Our team was focused on providing the best experience for house owners (landlords): to ease their understanding of the product, register new houses or apartments, and manage the rental and sale of theirs houses.
Together with the product manager and designer, we created a roadmap of features we wanted to ship that quarter. At the same time, performance is a critical piece of the puzzle to provide a good experience for users. We can start with the basic two "metrics": page-load and time to interactivity. There's a correlation (and sometimes causality) between these metrics and user experience.
We also wanted to ship A/B tests and make sure that performance was not a variable that could affect the results of these tests. Basically, we wanted to prevent performance regressions to not influence the tests (but we needed metrics - we'll talk about it soon!).
Our team was not a performance expert team. But the company has a team called Core UX, mainly focused on Web Performance. A team that had experience with frontend performance in the first 3 quarters of 2020.
The Process
Our first idea was to understand the metrics we wanted to track and take care of and do "discovery" tasks to understand potential issues and how we could improve the user experience and app performance. Along with that, we also tried to have a channel with the web performance team to discuss, learn from them, ask questions, and try to find performance issues and fix them.
So we opened a new Slack channel to ease this whole idea and have a bi-weekly meeting with them to show what we were working on, what they were working on, discuss possibilities to improve performance, and have time to ask questions and open discussions.
With this open relationship, we could learn faster and prioritize low-hanging fruit kind of tasks to have faster results with little or no effort at all. We'll discuss this in-depth later in the Performance Improvements section.
The whole process was documented: the meetings, our learning, our discoveries, and the performance fixes.
Metrics & Measure
We had the first discussion about the metrics we wanted to track and my team started to learn more about them. For us that didn't have much familiarity, at first, it was a bunch of acronyms we didn't truly understand. FCP, LCP, FID? What's that?
To understand these terms, I like to first understand the user experience metrics, because it's all linked together.
So, for user experience metrics, I like this User-centric performance metrics article by Google where it defines these metrics:
- Perceived load speed: how quickly a page can load and render all of its visual elements to the screen.
- Load & Runtime responsiveness: how quickly a page can load and execute any required JavaScript code in order for components to respond quickly to user interaction
- Visual stability: do elements on the page shift in ways that users don't expect and potentially interfere with their interactions?
- Smoothness: do transitions and animations render at a consistent frame rate and flow fluidly from one state to the next?
I like this because it's very relatable. As website users, we can understand these metrics (and possible frustration when using some "bad-performance" kind of websites).
This is also interesting because we can map the user-centric metrics to the performance metrics we commonly see.
- First contentful paint (FCP): measures the time from when the page starts loading to when any part of the page's content is rendered on the screen.
- Largest contentful paint (LCP): measures the time from when the page starts loading to when the largest text block or image element is rendered on the screen.
- First input delay (FID): measures the time from when a user first interacts with your site (i.e. when they click a link, tap a button, or use a custom, JavaScript-powered control) to the time when the browser is actually able to respond to that interaction.
- Time to Interactive (TTI): measures the time from when the page starts loading to when it's visually rendered, its initial scripts (if any) have loaded, and it's capable of reliably responding to user input quickly.
- Total blocking time (TBT): measures the total amount of time between FCP and TTI where the main thread was blocked for long enough to prevent input responsiveness.
- Cumulative layout shift (CLS): measures the cumulative score of all unexpected layout shifts that occur between when the page starts loading and when its lifecycle state changes to hidden.
I built a simple table to map the performance metrics to the user-centric metrics to be easier to understand each acronym.
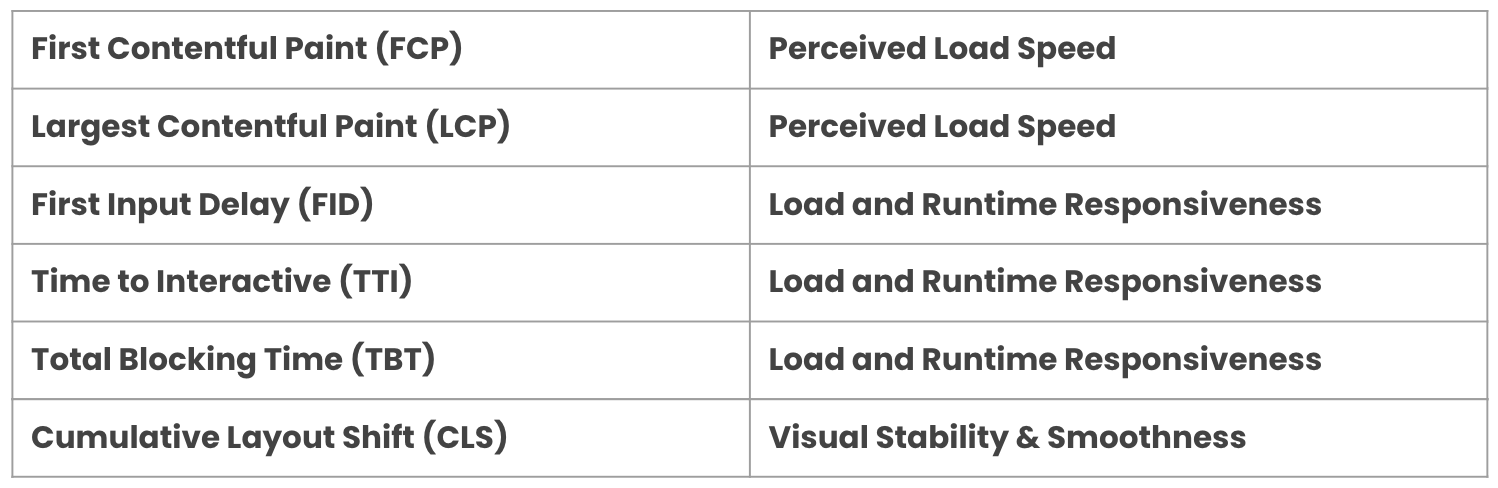
As I said earlier, this relation is very interesting and makes us focus not only on bits and bytes but also on the user experience as a whole.
Tooling, Audit & Knowledge Sharing
After having a better understanding of user experience and performance metrics, we wanted to start tracking them. There is a difference between Lab and Field metrics. According to Google:
- Lab metrics: using tools to simulate a page load in a consistent, controlled environment.
- Field metrics: on real users actually loading and interacting with the page.
Lab Metrics
For the lab metrics, we set up the Lighthouse in our CI using Lighthouse CI. So, for every Pull Request (PR) opened, we run the Lighthouse to gather performance-related data and lock PRs until we fix the performance issue.
With this tool, we can validate various aspects of the PWA (accessibility, SEO, best practices, and performance), but also add assertions to break PRs when it surpasses a budget threshold we set.
For example, we can add assertions related to JavaScript and images sizes (in bytes):
assertions: {
  'resource-summary:script:size': [
    'error',
    { maxNumericValue: 1000000 },
  ],
  'resource-summary:image:size': [
    'error',
    { maxNumericValue: 100000 },
  ],
  'resource-summary:total:size': [
    'error',
    { maxNumericValue: 1000000 },
  ],
},
This JavaScript object is part of the configuration we can use to gather different info about performance. To better understand the configuration for Lighthouse CI, take a look at this docs: Lighthouse CI Configuration.
Another very cool tool we are using for lab metrics is Speed Curve. It's super simple to set up and start gathering data. This tool works better for "unlogged pages" because we add the URL of the website, and based on the website load and interaction, it will collect performance metrics.
The Speed Curve dashboard is very flexible to show (or hide) the metrics we want to focus on. In our case, we wanted to see the evolution of the JavaScript total size, First Contentful Paint, Largest Contentful Paint, Cumulative Layout Shift, JS Total Blocking Time, Backend (TTFB) Time, and Lighthouse Performance Score.
This is working very cool for our landing and home pages.
The last tool we set up is an in-house tool the performance team built. This is a tool to analyze the app bundles and it has 3 main features now:
- Bundle Analyze Report: collects and saves the bundle analyzer HTML results.
- Bundle Budgets: sets up a budget configuration to add a threshold for the bundle sizes. It breaks the PR if the size of a bundle surpasses the threshold.
- Bundle Changes: shows the bundle size changes between the PR and the master (or main) branch. It helps us easily answer "did it increase/decrease the bundle size for X?"
This tool is run in our CI pipeline for every PR and the result is shown in the Github PR (it uses Danger behind it).
These tools are very interesting because
- it helps us prevent performance regressions
- it also creates awareness about web performance, its metrics, and share knowledge
Field Metrics
For now, we are using Instana to collect Real User performance-related data.
The next step for Real User Monitoring (RUM) is to track more user behavior in our application to gather web vitals metrics in the PWA flow.
Performance Improvements
In this section, I want to detail the process behind each discovery and fixes we did to improve performance and user experience in our application.
Landing Page
We started with our landing page. The first action was to analyze the JavaScript bundle size using Webpack Bundle Analyzer.
Side note: 2 years ago, the team responsible for the landing page decided to use a tool to develop the landing page with react but in the build time, we remove the react from the application to reduce the bundle size served in the landing page.
And this is what we got:
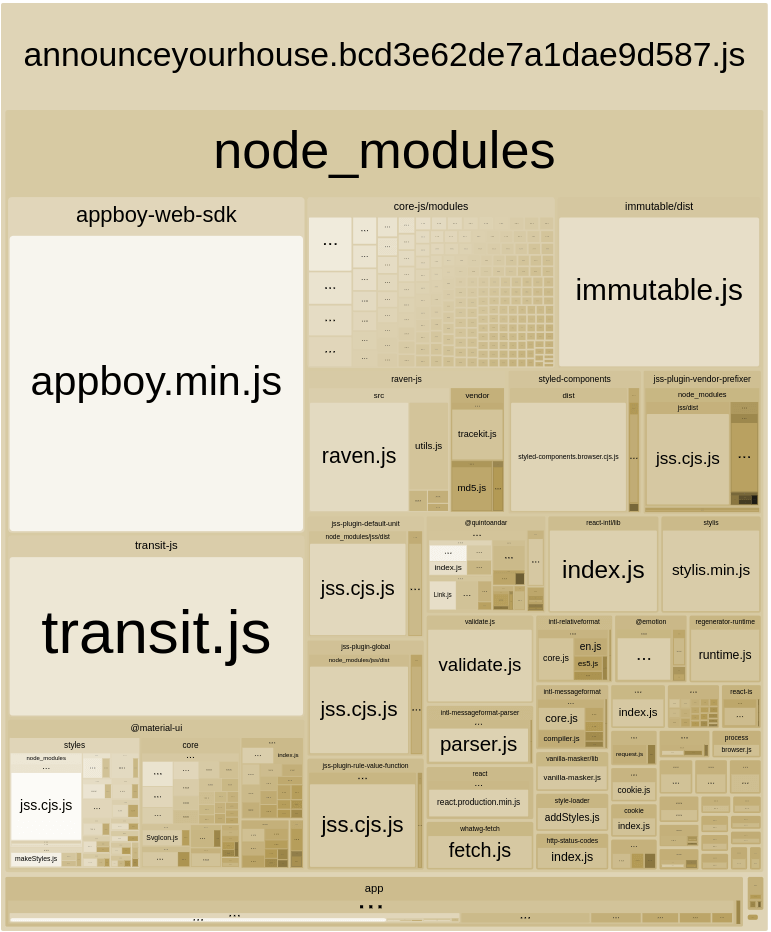
We can analyze a lot of things here, but one that got our attention was the React library in our landing page bundle. As I wrote above, in the side note, React is not being used in production, and we are unintentionally serving it in production making our users download the library without the need to do this.
// components/XYZ.js
import React from 'react';

export const A_CONSTANT = 'A_CONSTANT';
We had a constant inside a React component file. And we were importing that constant in the landing page.
// landing.js
import { A_CONSTANT } from 'components/XYZ';
So importing this constant, we were also importing React.
A possible simple fix was to separate this constant outside the React component file and import it from this new file.
// components/XYZ/constants.js
export const A_CONSTANT = 'A_CONSTANT';
And import the constant from the new file:
// landing.js
import { A_CONSTANT } from 'components/XYZ/constants';
Let's see the bundle size impact after this change:
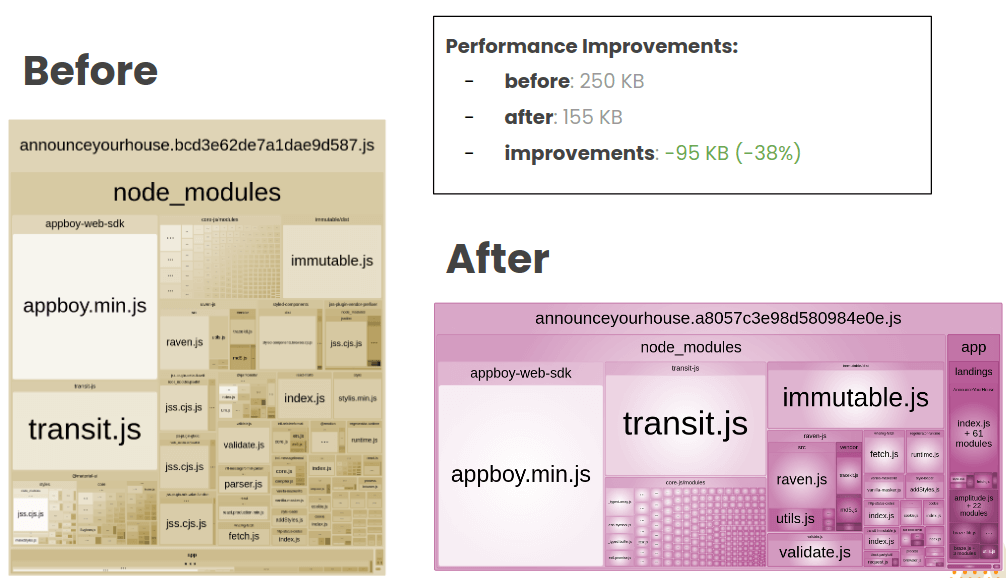
We reduced 95KB! It's interesting to think we can have a huge impact on a small change after carefully analyzing our bundles. This will be the process behind each improvement we did for the rest of this article:
- Analyze the bundles
- Fix the performance issue
- Gather results & keep track of the metrics
We run again the bundle analyzer and we got this:
The first things that got our attention were the appboy.min.js and the transit.js libraries. The appboy is the Braze, a library we use for communication, and the transit is a library to transform JSON format data into our app state.
The Braze library was very similar to the React library. It was an import statement in a file that the landing page was using but not really using the Braze.
// braze.js
import braze from 'appboy-web-sdk';

export const aFunction = (brazeInstance = braze) => {
  // do something with braze
};
It was importing Braze in the file and using the instance as a default value for a function. The simple solution was to remove the import statement and enforce that every place that was using the aFunction function passes the braze instance. So we don't need to import Braze and add a default value to the parameter:
// braze.js
export const aFunction = (brazeInstance) => {
  // do something with braze
};
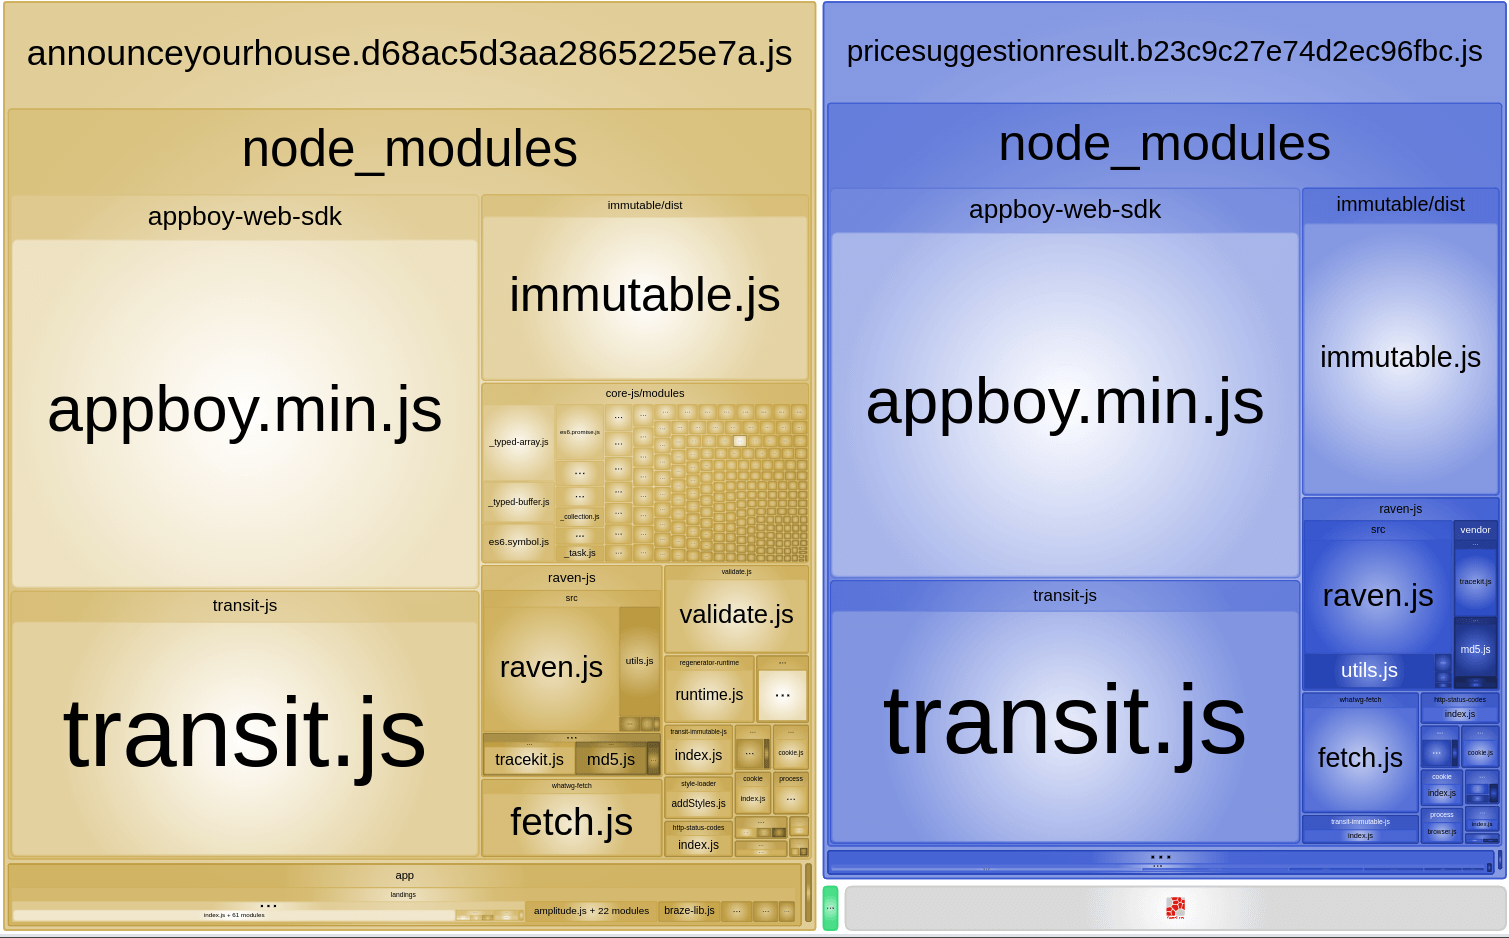
Running the bundle analyzer again, we got an astonishing result.
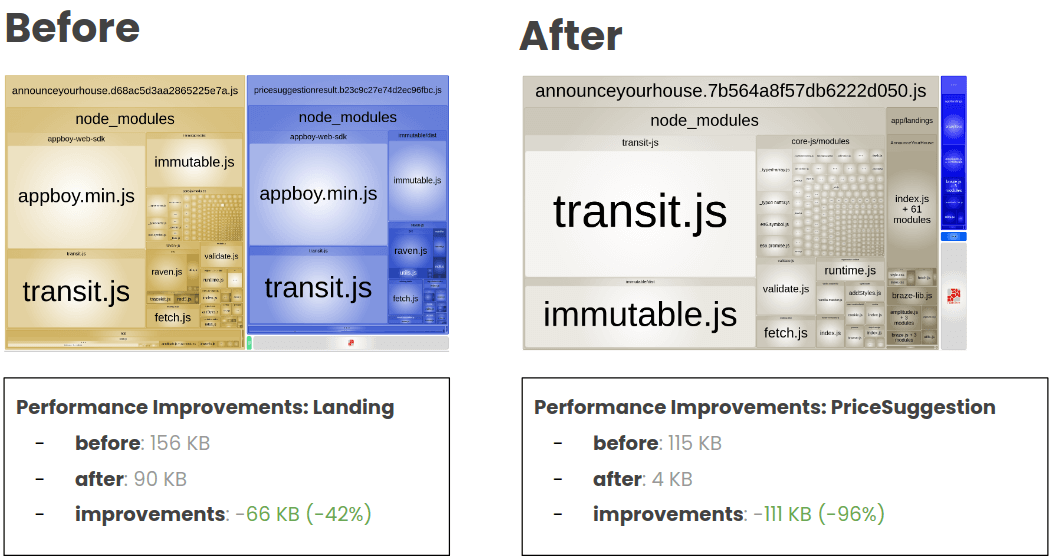
The AnnounceYourHouse landing page was reduced to 90 KB. We could remove almost 50% of the main landing bundle.
We also improved a lot the bundle size of the PriceSuggestion landing page. From 115 KB to 4 KB was an amazing result.
For the transit library, we did a temporary workaround solution. It was importing the library to transform the string JSON saved in the local storage to get info from a single attribute from this object.
The temporary solution was to verify if the string included the info we wanted and remove the need to use the transit library.
We could improved a lot the bundle size of the main landing. Removing almost 50% of the bundle.
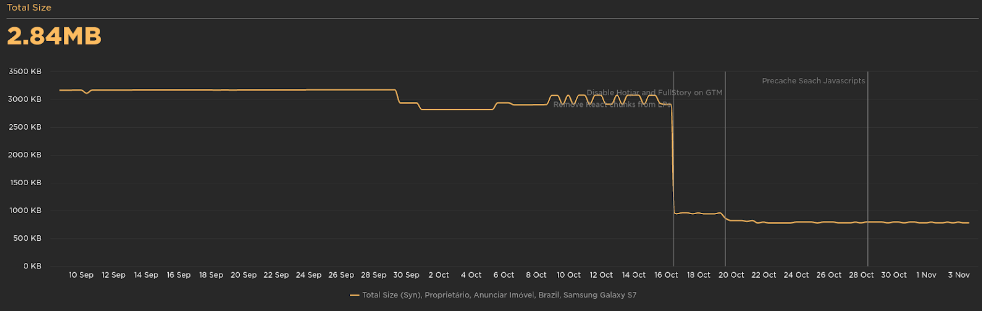
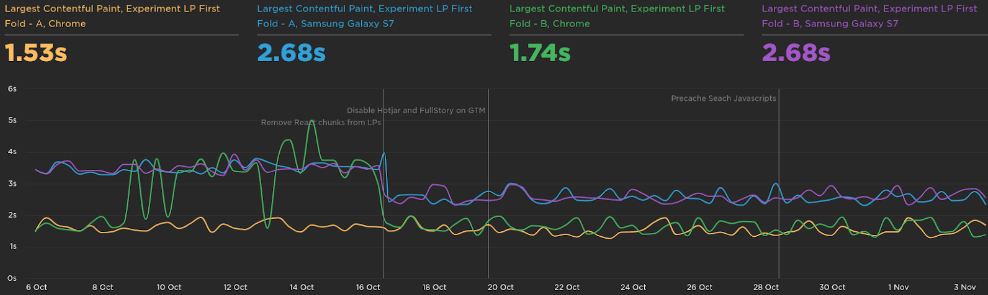
As we saw in the metrics section, we had set up the Speed Curve to track the performance of some pages in all this journey. So, for every improvement we made in our application, we keep track of the metrics in these tools.
The total size of the landing page reduced drastically: -2.16 MB.
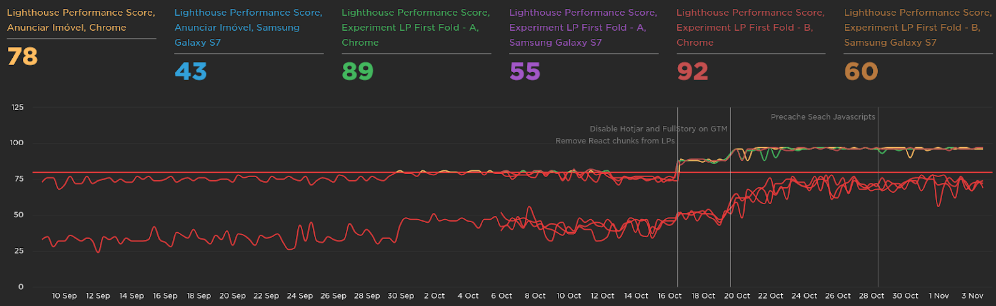
The Lighthouse Performance score was from 73 to 97:
The Largest Contentful Paint was improved in 1s:
Vendor Chunk
When running npm run bundle:analyzer, we also notice a big dependency in our vendor chunk.
![]()
In the vendor chunk, we noticed all the icons from Material UI. Every time a user enters the website, and if the chunk is not cached in the browser, it would need to download the whole chunk. If it's a big chunk to download, it has an impact on the performance and consequently on the user experience.
This is a common problem when importing a Material UI icon in a React component.
One of our components was using an internal component library that used the "named import" style to import the Material UI icon. This, without a proper babel plugin, also adds the rest of the unused icons to the vendor chunk.
We came up with two solutions:
- Fix the import from this internal component library we had stopping the use of named import.
- Add the babel plugin and configure the app to not add unused modules.
As this internal component library was the first and the deprecated version of our design system, we didn't want to keep maintaining it. The best approach was to not use this library anymore and move all the codebase to use the new design system library (and we're working on it!).
This performance project was not our main project in the quarter so we had less time to focus on it in the sprint. The babel plugin was a more straightforward and simple solution for us at that moment.
We basically needed to add this new babel plugin babel-plugin-transform-imports and configure the babelrc:
[
  "babel-plugin-transform-imports",
  {
    "@material-ui/core": {
      "transform": "@material-ui/core/esm/${member}",
      "preventFullImport": true
    },
    "@material-ui/icons": {
      "transform": "@material-ui/icons/esm/${member}",
      "preventFullImport": true
    }
  }
]
And with it, we prevent the full import of the library in the vendor chunk.
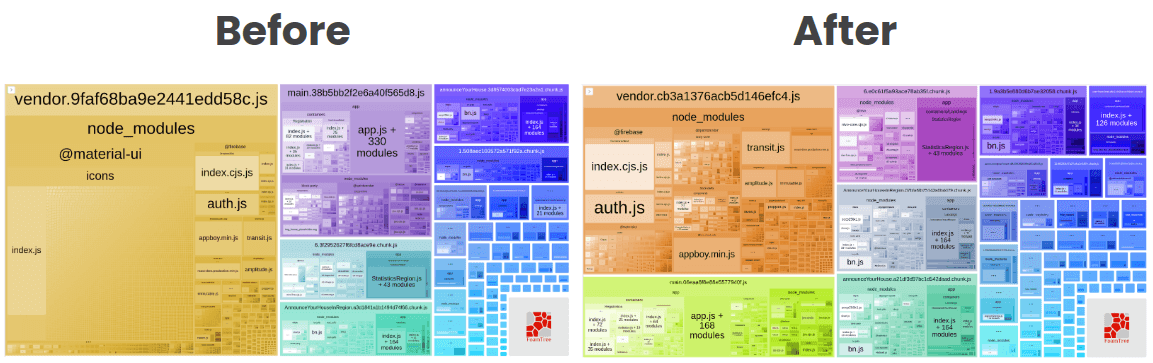
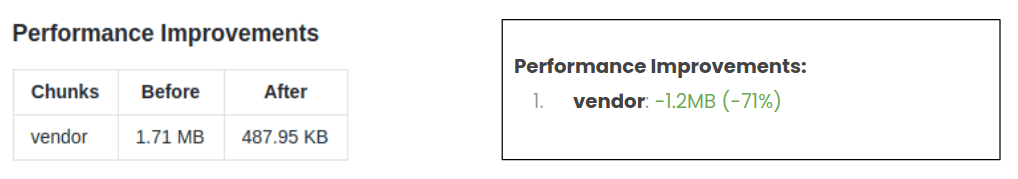
The vendor became way smaller. We also had some impact in the main chunk (the next chunk will talk soon).
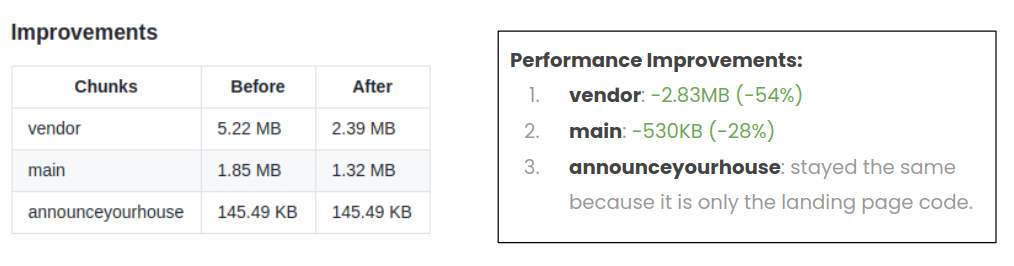
With this simple analysis and configuration, we could reduce the vendor chunk by more than 50% (it's still 2.83 MB and could be improved. We will see later!) and the main chunk by 28%.
A huge improvement for the whole app as these chunks were downloaded on each page, if not cached in the browser.
Main Chunk
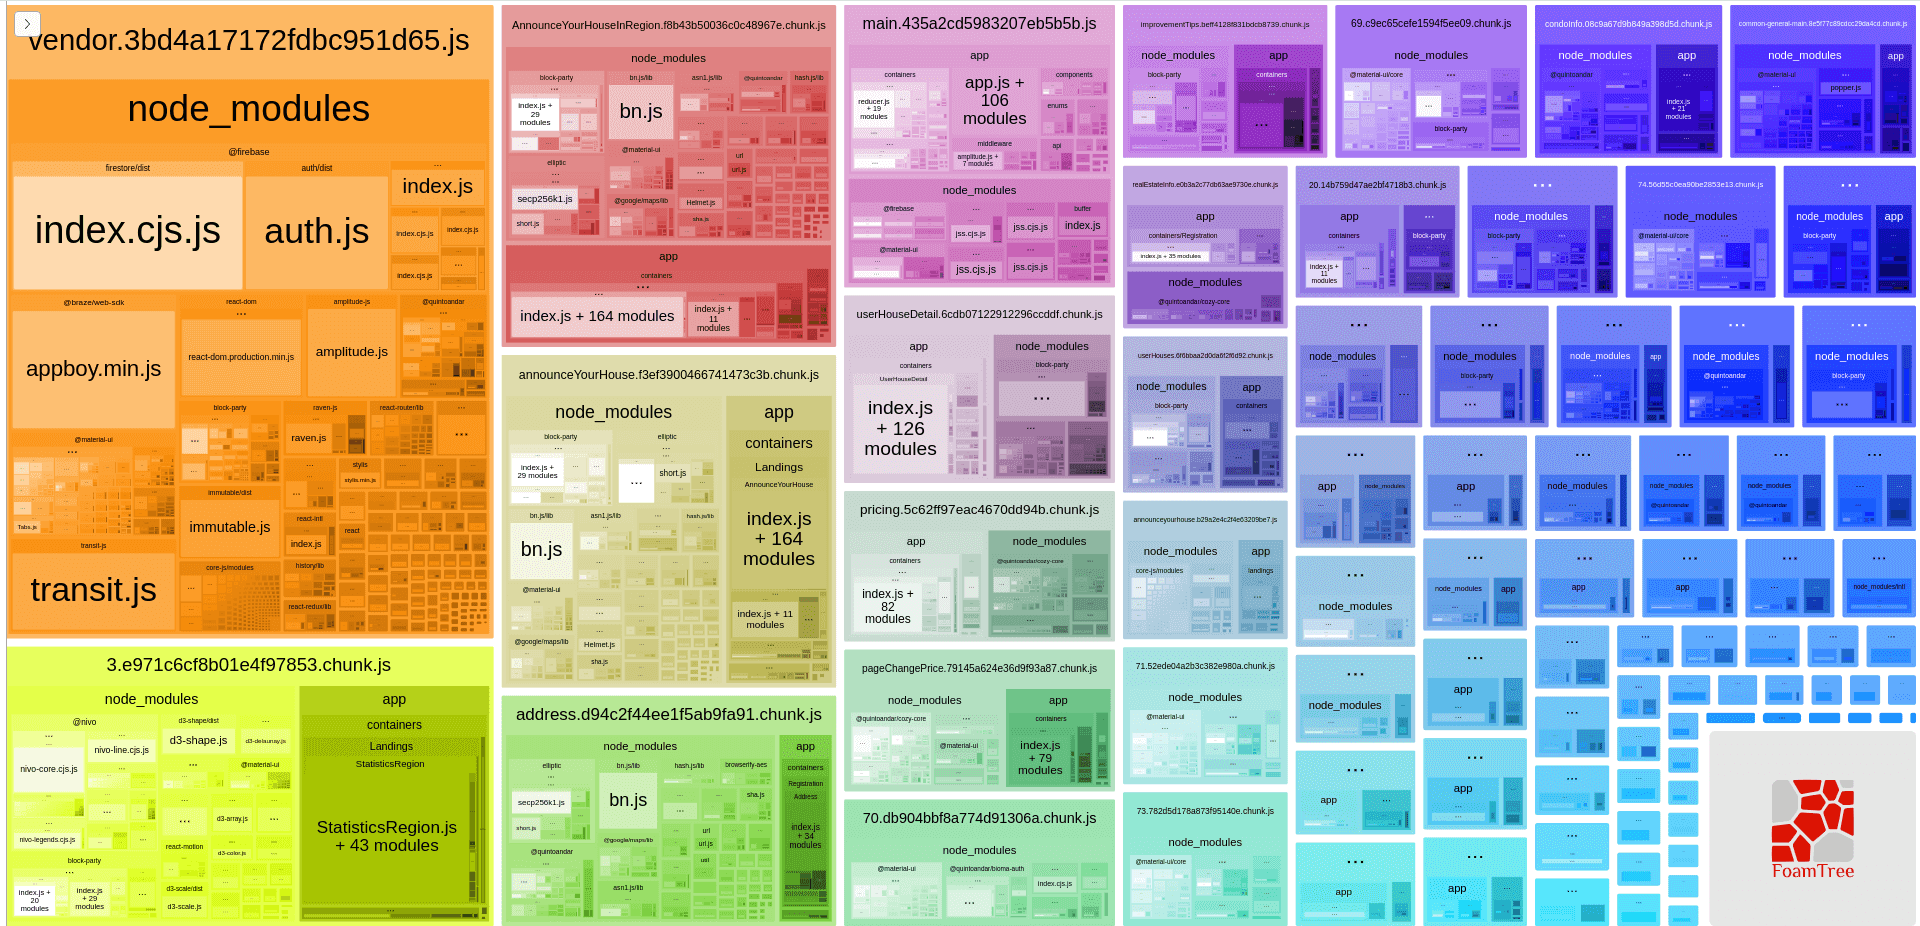
The main chunk has some common modules among all parts of the application. But after running the bundle analyzer, we got this:
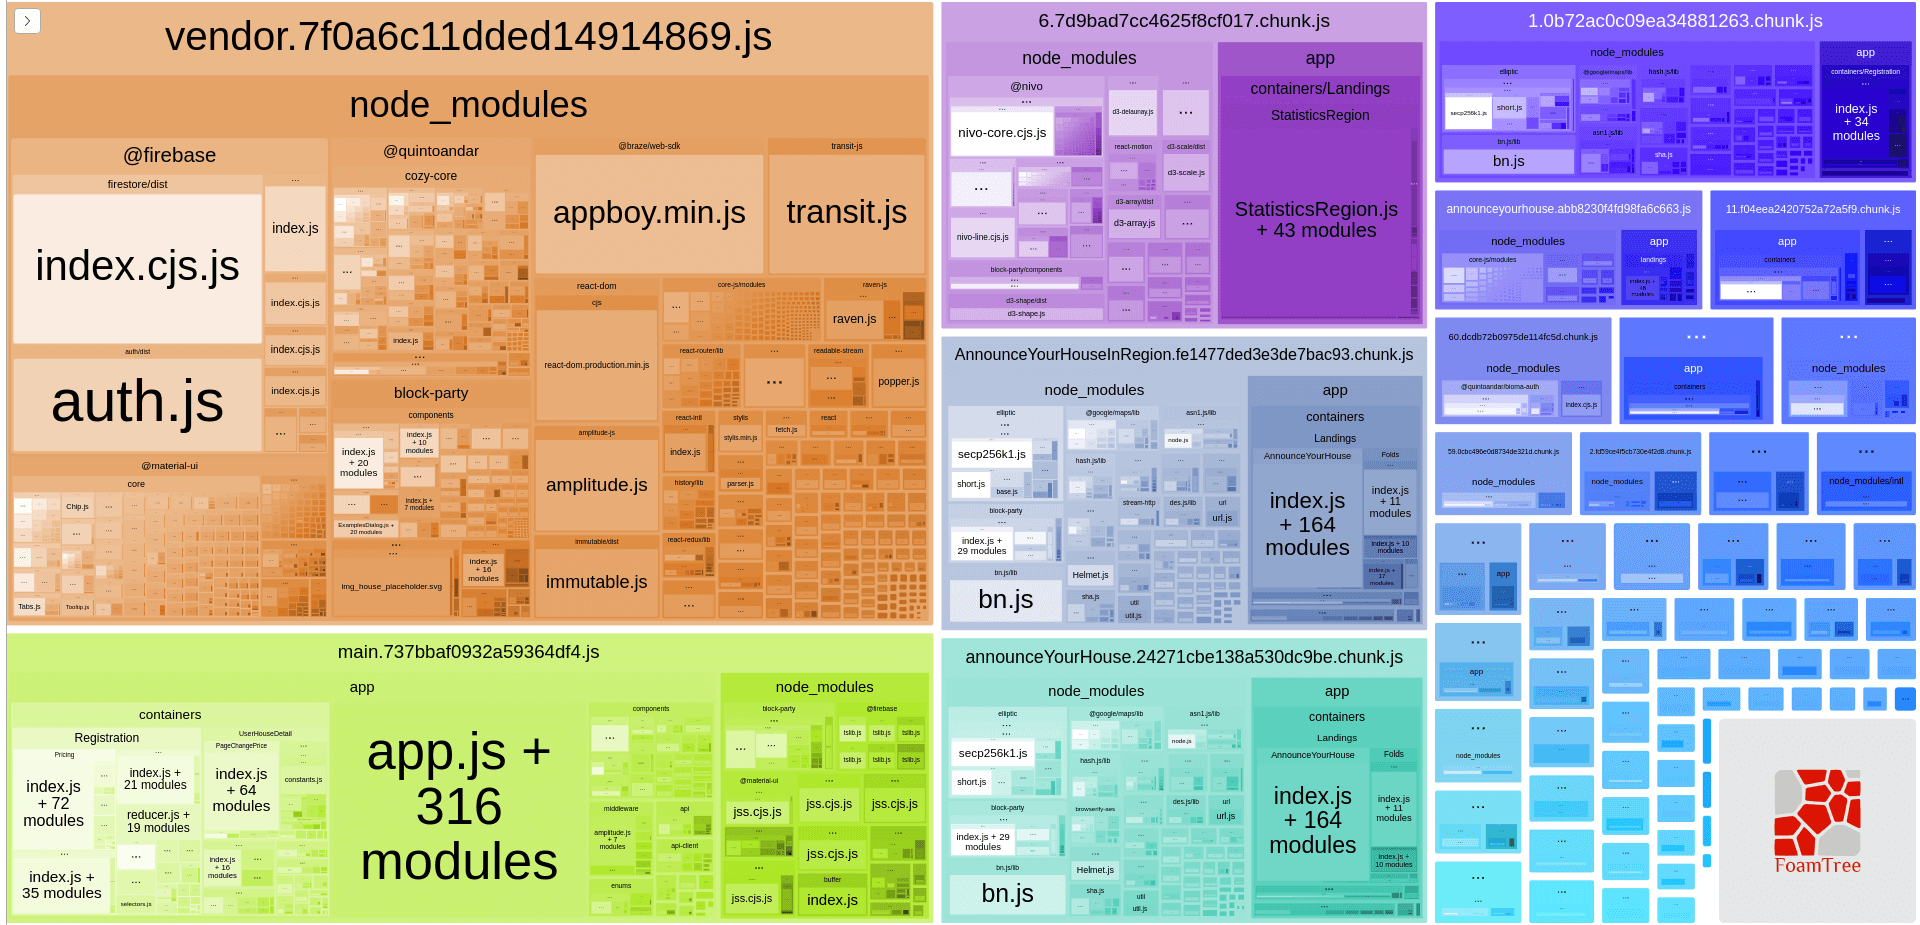
The main chunk is the bottom-left block in the bundle. One thing that got our attention was some containers and components in the bundle. Why are there some components that are specific to only one page but we are making our users download the whole main chunk?
The issue was simple: our code splitting was not working properly.
Our initial idea was to make sure all routes had dynamic import for our components to code split in each router entry point. And this was the problem: not all routes entry points had loadable components, so they were joined in the main chunk instead of creates their own chunk for that specific route and page.
In this application we were using, at that time, react-loadable, so the idea was to simply create these loadables:
import Loadable from 'react-loadable';

export default Loadable({
  loader: () => import(/* webpackChunkName: "component" */'./Component'),
  loading: () => null,
});
And use them for each route entry point.
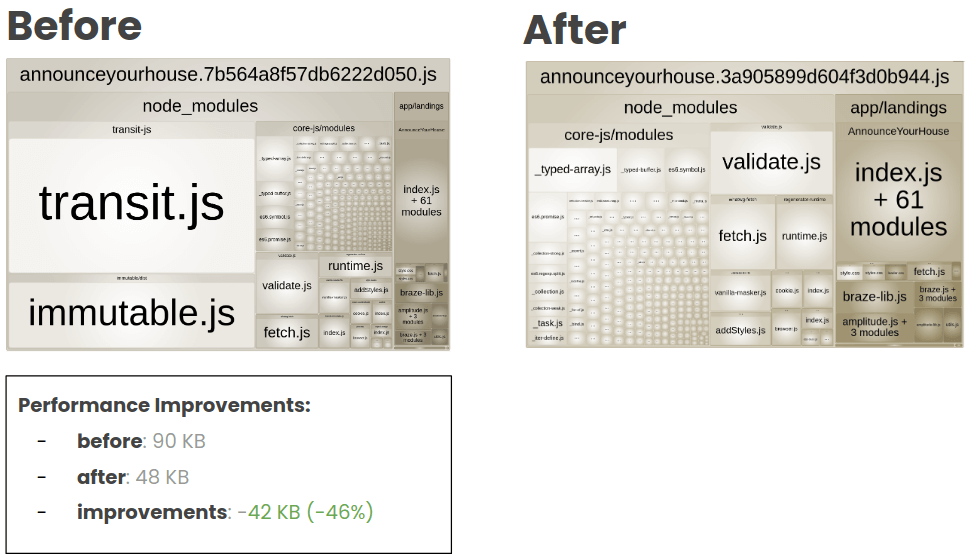
Running bundle analyzer, we got this:
The main chunk is way smaller and Webpack created more page-specific chunks as well.
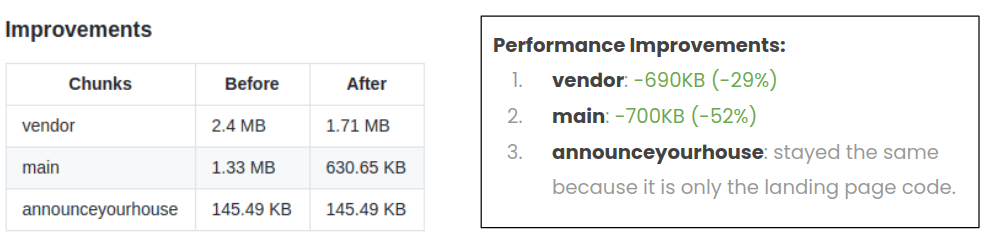
The result was huge. The main chunk got more than 50% smaller and the vendor chunk also decreased by 29%.
Caching Biggest Dependencies
Reading this article, you probably saw some big dependencies in our bundle like firebase, braze, immutable, and so on.
Every time we do a new product release, our build system generate a new bundle with the chunks. If anything related to the vendor chunk changes, Webpack will generate a new hash for the chunk. So the browser will not have a cached version for this chunk and it will make the user download it again.
But sometimes, or most of the time, we don't really change these biggest dependencies (only when the dependency is upgraded), and we are making our users paying for that huge chunk.
Our idea was to split these biggest dependencies in its own chunk and make sure the browser has a cached version of this chunk and the user doesn't need to download it again until it is needed.
As we were using Webpack 3 at that time, we needed to use the CommonsChunkPlugin to split these dependencies in its own chunk.
We created a list of all biggest dependencies:
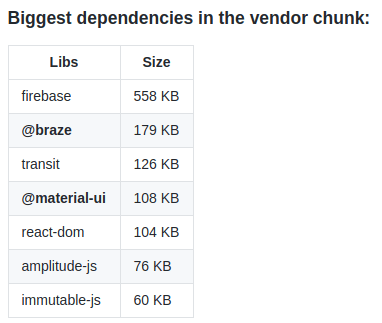
It was mapped as a list data structure in our Webpack config as well:
const VENDOR_LIBRARIES = [
  {
    name: '@firebase',
    label: 'firebase',
  },
  {
    name: '@braze',
    label: 'braze',
  },
  {
    name: 'transit-js',
    label: 'transit-js',
  },
  {
    name: '@material-ui(?!\\/icons)',
    label: 'material-ui',
  },
  {
    name: 'react-dom',
    label: 'react-dom',
  },
  {
    name: 'amplitude-js',
    label: 'amplitude-js',
  },
  {
    name: 'immutable',
    label: 'immutable',
  },
  {
    name: 'raven-js',
    label: 'raven-js',
  },
];
Along with CommonsChunkPlugin, we just needed to iterate through this list to create each chunk.
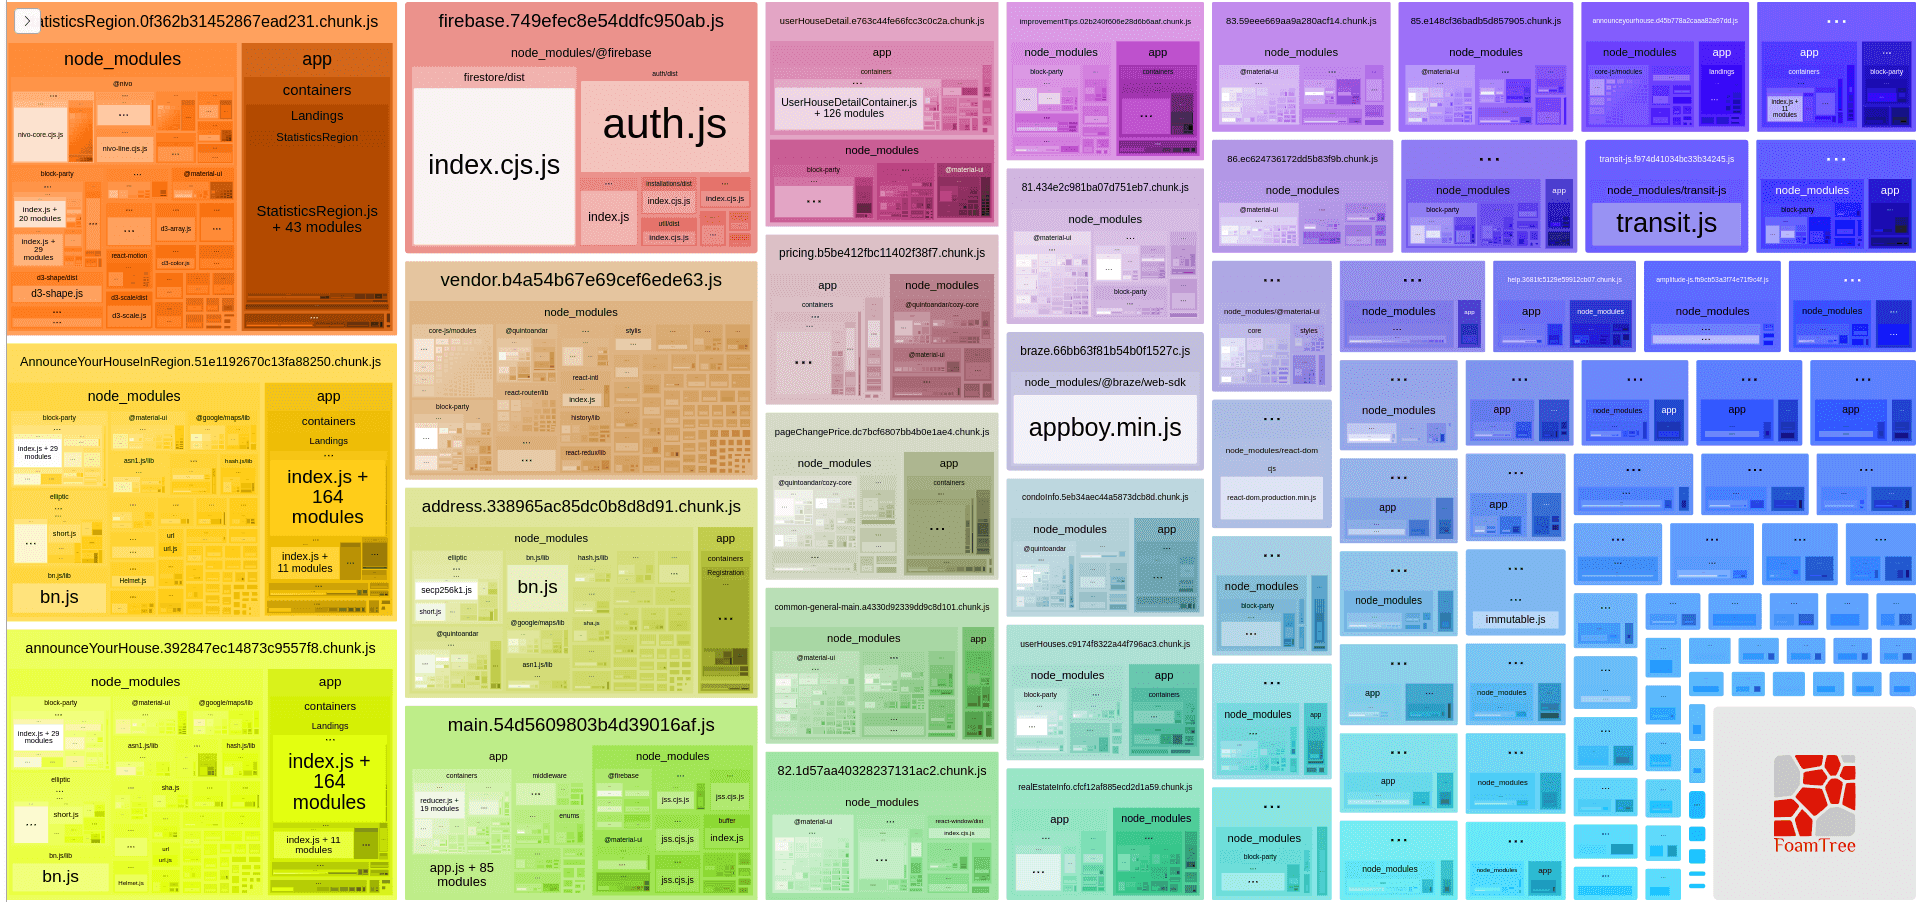
We can see that the vendor chunk got way smaller and some new chunks were created.
Running the application, we can also test the download of each separate chunk.
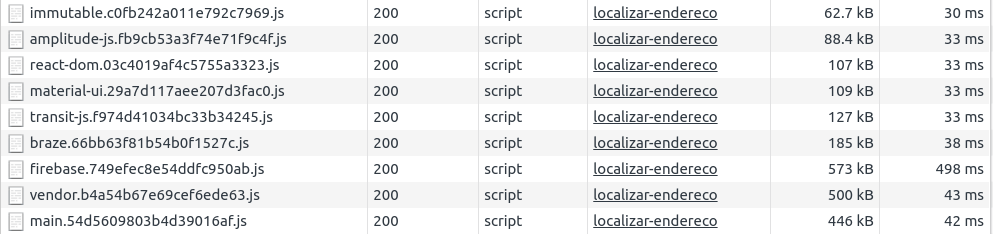
And we got a really cool result:
The user still needs to download the dependencies, but after download the first time, the browser will cache them and they won't need to be downloaded again until we bump their version. If we change the vendor chunk, Webpack only generates a new hash for the vendor and doesn't change the other dependencies.
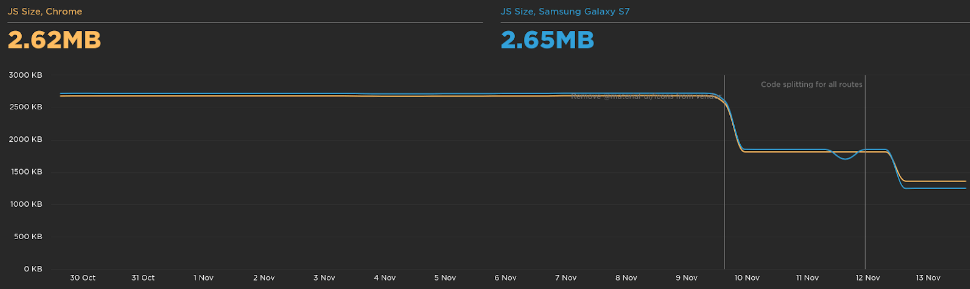
We saw some nice improvements in the Speed Curve dashboard:
As expected, we saw a huge improvement in the JavaScript size: -1.43 MB
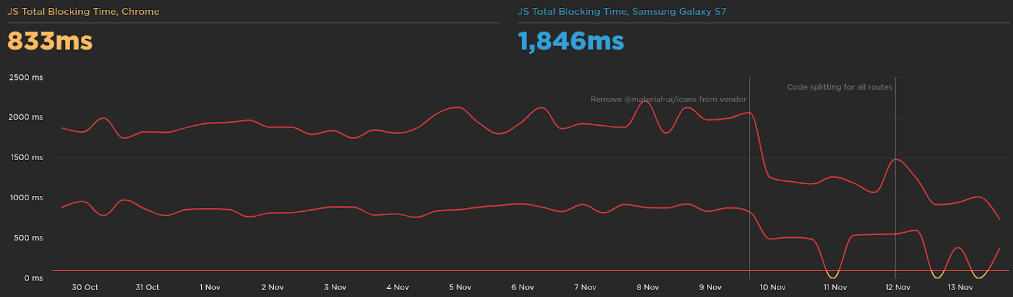
Decreasing the JavaScript size also had an impact on the total time the user is blocked to interact with the page: -1.2s
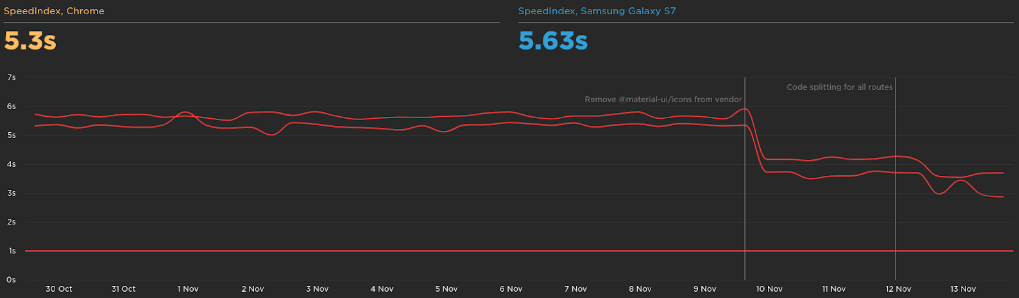
The speed index is a metric to show how quickly the contents of a page are visibly populated. We improved the page to load 2.2s faster.
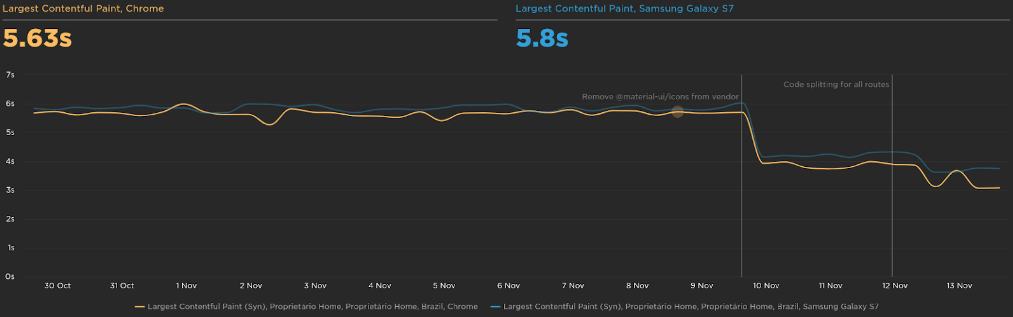
And the largest contentful paint went from 6s to 3.75s.
Recap
To recap what we saw in this article, let's see the list of things we did in this journey:
- Measure: metrics as the foundation of performance improvements.
- Lock: prevent regressions & scale the performance knowledge.
- Analyze: with data and metrics, analyze the possible problems.
- Improvements: code.
- Impact: measure the before and the later picture.
I would also recommend talking to more experienced people in this performance domain if it is possible.
Next steps
We have more things to do, but we didn't have time to focus on those things in the last quarter. This is a list of things that come to my mind now:
- More metrics: rum for logged pages, ux metrics (engagement, bounce rate), business metrics (conversion).
- Manage requests: server requests caching.
- More Analysis: backend, chunks, prefetching, etc.
- Removable Dependencies: analyze big dependencies that can be removable or replaced
- Webpack Upgrade: bump to v5 - cache, optimization, code-splitting, tree shaking.
- Webpack Optimization: the need to build faster.
- Keep studying: learn more to discover more opportunities.
Resources
I have some resources I used along the way while doing this project. I hope it can be helpful to you too: Web Performance Studies.

WorksHub
Jobs
Locations
Articles
Ground Floor, Verse Building, 18 Brunswick Place, London, N1 6DZ
108 E 16th Street, New York, NY 10003
Subscribe to our newsletter
Join over 111,000 others and get access to exclusive content, job opportunities and more!